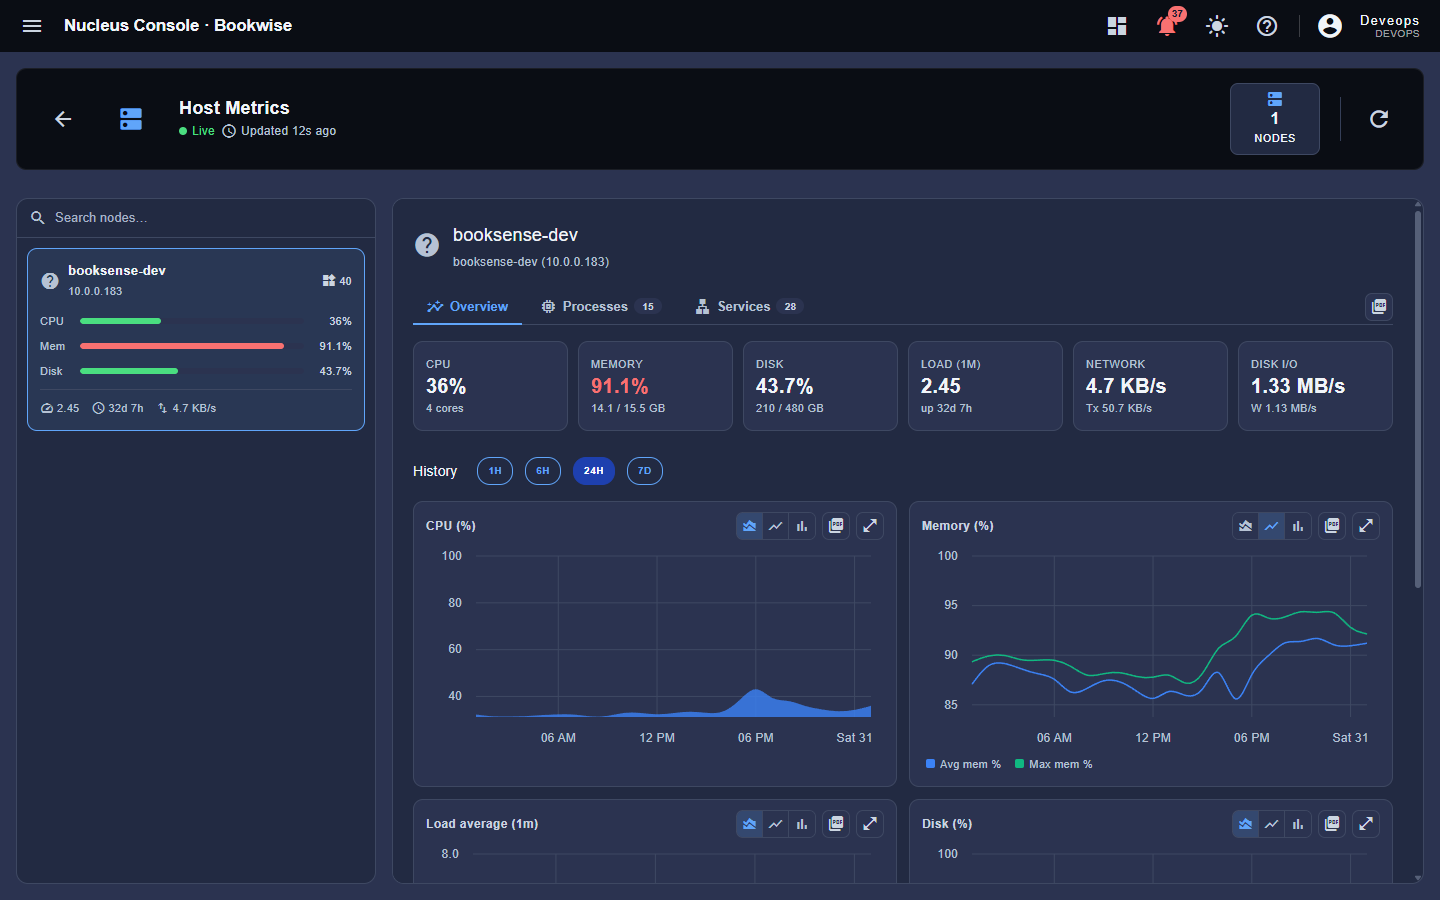
No agent to install, no dashboard to build. A Nucleus Framework service self-registers with live health, CPU, memory, disk, threads and GC — then, when you need to dig in, records a diagnostic window and replays logs, GC pauses, thread dumps and CPU/heap on one synchronized timeline.
Add the dependency, enable the monitoring profile — that's the whole setup.
Each service pushes a health snapshot over Kafka on an interval; the monitoring service aggregates every instance into one fleet registry. Nothing to wire per service — it appears the moment it boots.
Live CPU load, heap used/max, non-heap, thread count, DB pool, disk and uptime per instance — with history charts so you see the trend, not just the current value.
An instance that goes stale or unhealthy turns red in the console, and alerts are pushed live over server-sent events — you hear it from the platform, not from a customer.
Remote logs stream to a searchable Log Explorer with infinite scroll and a timeline playback mode. Filter by service, level or a single user's session id to follow one request across every service it touched.
Turn remote logging on or off per service from the console — no redeploy, no logback edit. A Keep across restarts toggle persists the choice so a specific instance boots with it active; a hard allowed=false lock can forbid it entirely.
Ambient logs and metrics are retained for a configurable window, then archived to MinIO object storage and purged from the database — history stays available without the database growing forever.
When ambient monitoring isn't enough, record a window and scrub it back on one clock.
Arm a capture window ahead of time — tonight's 03:00 batch, next Tuesday's release — choosing the log level and which signals to capture. Or press Record Now on a live instance when something's happening.
Inside the window, logs, GC events, thread dumps and CPU/heap samples are tagged with the recording's id as they stream in — the service's own per-instance settings are applied through the audited property gateway, never by writing to its tables.
Scrub a single cursor across five aligned tracks and see exactly what coincided — the log line, the GC pause that interrupted it, the threads that were running, the CPU and heap at that instant. Bundles archive to MinIO for later.
Every HTTP request also carries a session id from the browser through every backend service into each log line — so "trace this user's whole session across services" is a single search, live or in a recording.